See Exactly Where You Lose Strokes
Stop guessing what to practice. Strokes Gained analysis and shot heatmaps show the specific areas costing you strokes — so every practice session has a purpose.
- Strokes Gained breakdown: driving, approach, short game, putting
- Shot heatmaps showing your patterns on the course
- Trend tracking across all your rounds
- Benchmarked against golfers at your handicap
Why it matters
Strokes Gained analysis
Know exactly which part of your game costs you most. Driving, approach play, short game, and putting — each measured against your handicap benchmark.
Shot pattern heatmaps
Visual maps showing where your shots land. Spot patterns instantly — like consistently missing approach shots right, or struggling from a specific yardage.
Trend tracking over time
See whether you're improving, holding steady, or regressing in each area. Month-by-month and round-by-round breakdowns show the full picture.
How it works
Track your rounds with GPS shot recording
Every shot you record feeds automatically into your analytics. No extra input, no manual stats entry.
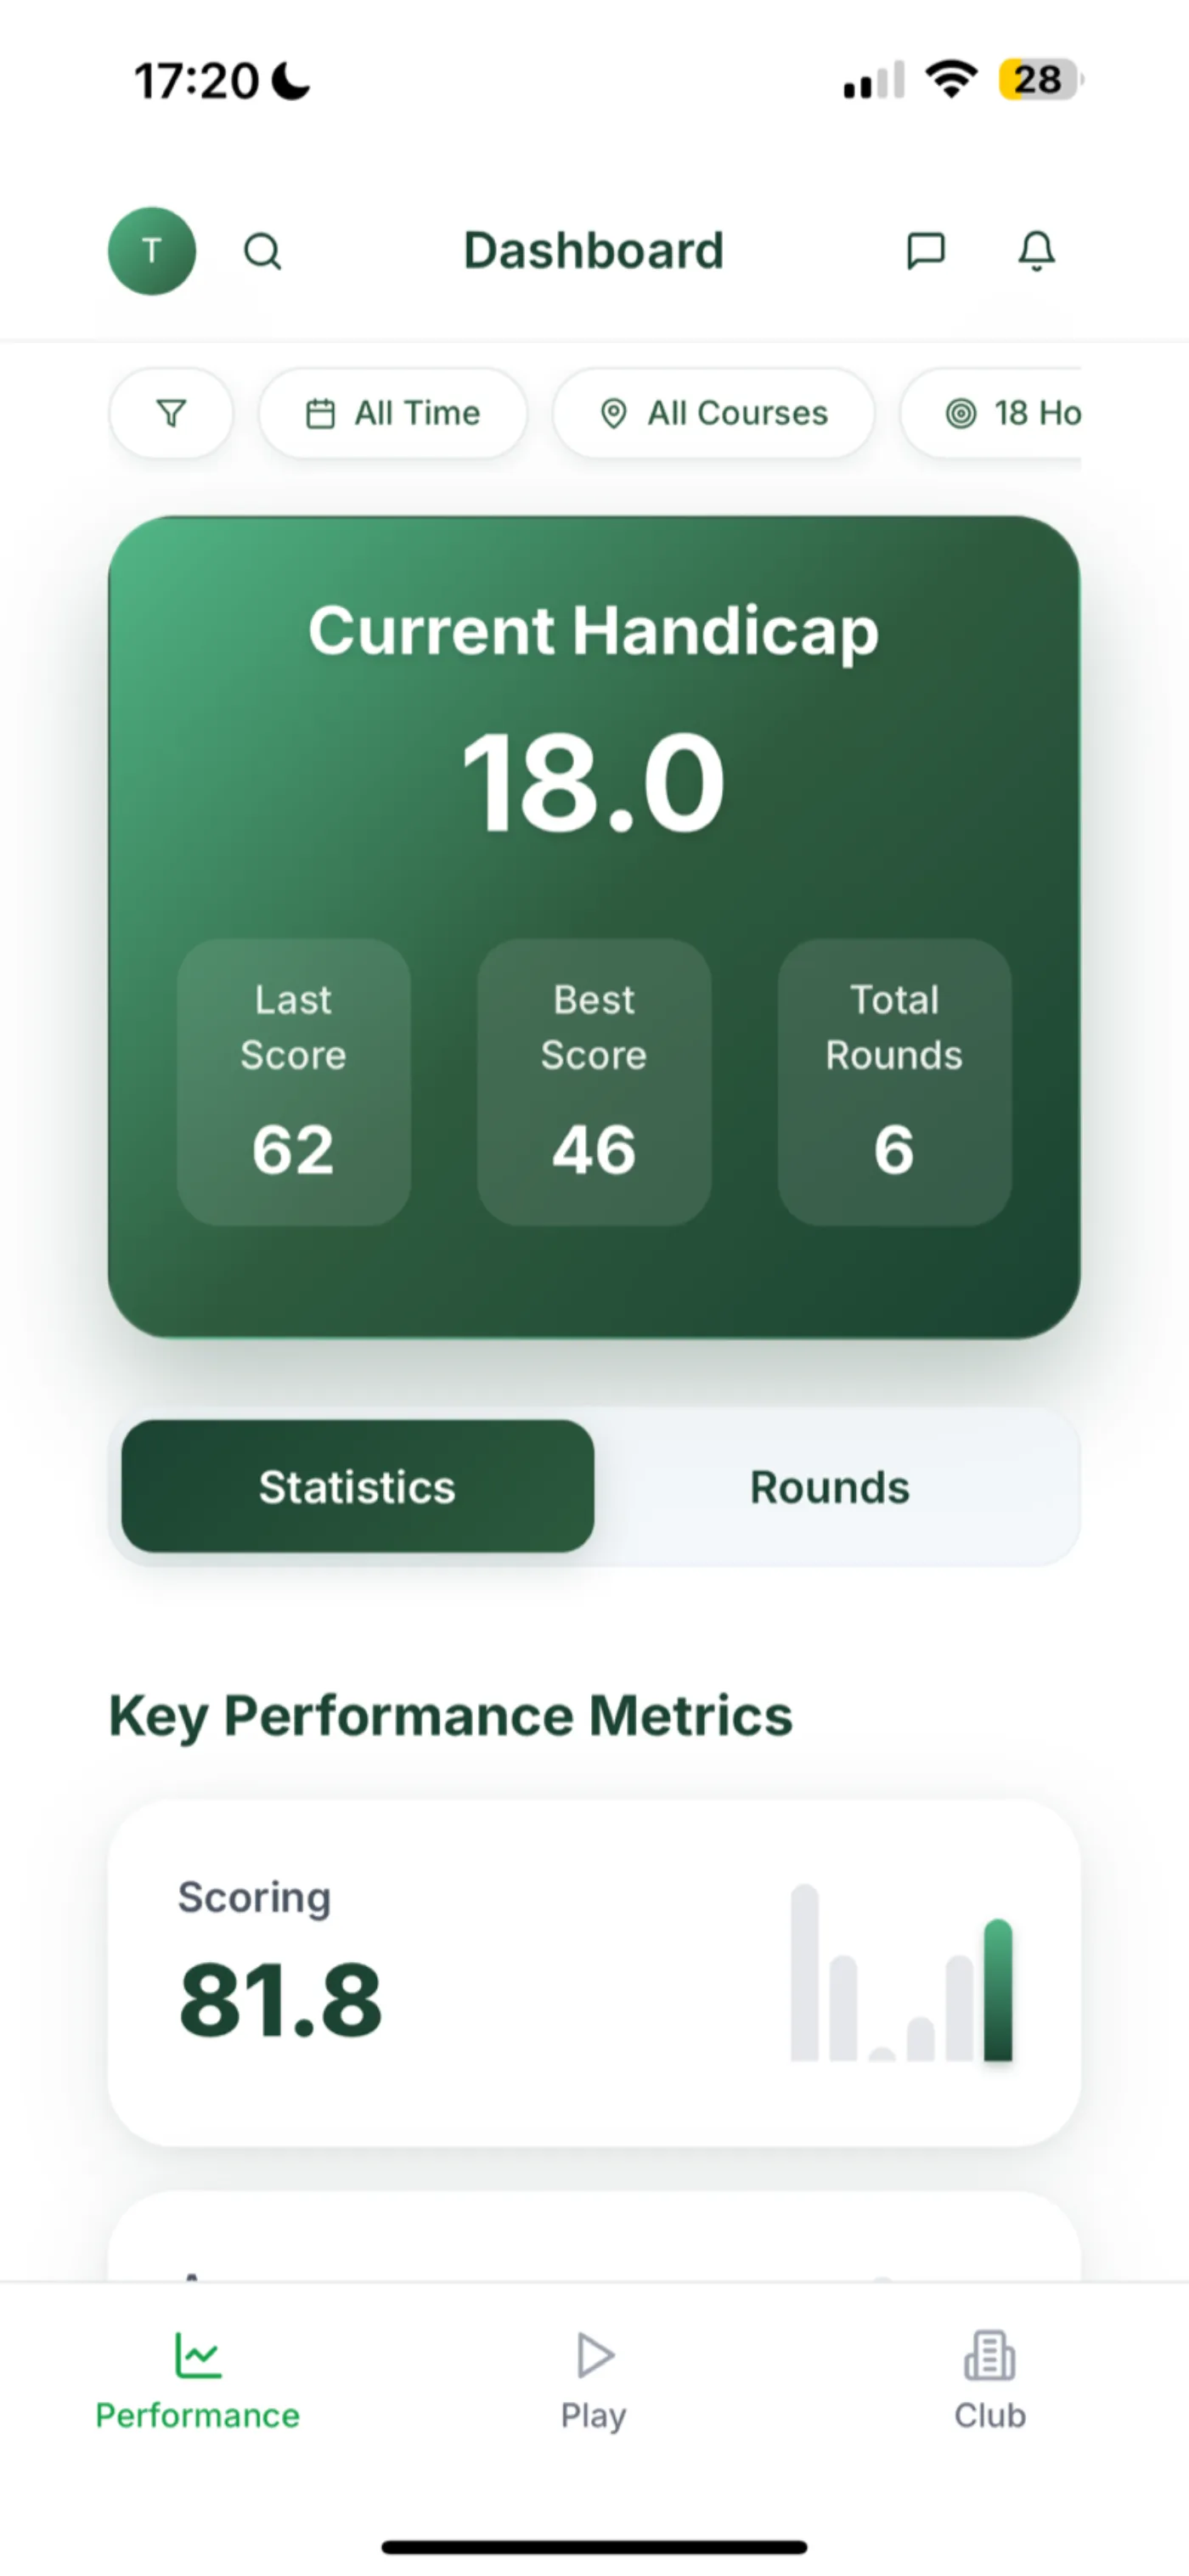
Review your analytics after each round
Open your dashboard to see Strokes Gained, heatmaps, and how today's round compares to your recent average.
Target your weakest area in practice
The analytics tell you exactly where to focus. Book a lesson with your pro or structure your range session around your biggest weakness.
Frequently asked questions
Know your game. Improve faster.
Free for all golfers. Start tracking today and your analytics dashboard builds automatically from your first round.
Start free today